How it works: one example from start to finish
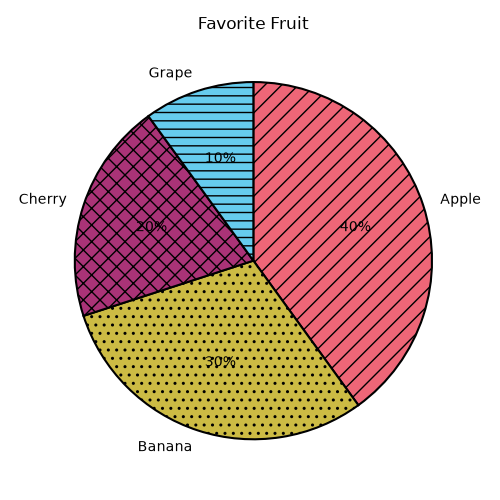
This page follows one pie chart, "Favorite Fruit", through every step. Everything shown below was made by this website from that chart, the same way it would be for your own image.
Want a different kind of diagram? Browse all six samples.
Step 1: Upload the image
On the Upload page, choose, drag in or paste one image. You can add the subject, grade band and learning objective, and tick "This is for an assessment" to turn off summaries.
- Subject
- Math
- Grade band
- 6-8
- For an assessment?
- No
- Language
- English
Step 2: The AI reads it
Press "Read this image". Three stages run, each shown with its status:
- Identify the type: pie chart. If the AI isn't sure, you're asked to confirm.
- Read the text: title "Favorite Fruit" and each slice label.
- Read the structure: 4 slices and their values.
Text the AI can't read is left blank and flagged for you. It is never guessed.
Step 3: You review and correct
On the Review page the original sits next to a clean redrawing made only from what was read. Fix any label or value in the table; Undo works with Ctrl/Cmd+Z. Nothing can be exported until you mark it as reviewed.
Redrawn from what was read
Slices table (editable on Review)
| Label | Value | How it was found |
|---|---|---|
| Apple | 40% | Printed on the chart |
| Banana | 30% | Printed on the chart |
| Cherry | 20% | Printed on the chart |
| Grape | 10% | Printed on the chart |
Step 4: Export for your student
The Export page makes every output from the reviewed record, never from the image. Here is what this chart produces.
Short description (alt text)
Pie chart titled 'Favorite Fruit' with 4 slices. Long description and data table follow.
Long description
Pie chart titled 'Favorite Fruit'. The pie has 4 slices, running clockwise. Slices in order: Apple, 40 percent; Banana, 30 percent; Cherry, 20 percent; Grape, 10 percent. A data table with the same values follows.
Data table
| Slice | Value (percent) |
|---|---|
| Apple | 40 |
| Banana | 30 |
| Cherry | 20 |
| Grape | 10 |
Tactile graphic (for a swell-paper or embosser printer)
Each slice has its own texture that feels different from its neighbours, slices are slightly apart, and labels are in braille. A separate key page explains the textures.
Key
- solid raised fill: Apple
- horizontal line texture: Banana
- dotted texture: Cherry
- vertical line texture: Grape
The Export page also offers a high-contrast picture (SVG, PNG or PDF), a keyboard-explorable chart, an accessible web page, a CSV file, and a zip with everything.